-
선형회귀(linear regression)ML 2022. 7. 14. 17:55반응형
단순(simple) 선형회귀(linear regression)는 y = ax + b (일차함수)
다항(polynomial) 선형회귀는 y = a * x ^ 3 + b * x ^ 2 + c * x + d (다항식)
다중(multi) 선형회귀는 y = a * x1 ^ 3 + b * x2 ^ 2 + c * x3 + d단순선형회귀
넘파이로 단순선형회귀
import numpy as np
import matplotlib.pyplot as plt

budget = np.array([5, 10, 17, 27, 35, 40, 42, 49, 54, 60])
revenue = np.array([2.6, 19., 23.8, 26.9, 41.1, 58.3, 40.3, 58.7, 73.1, 69.7])

m = np.polyfit(x=budget, y=revenue, deg=1)

print(m)

plt.scatter(x=budget, y=revenue)
plt.plot(budget, np.polyval(m, budget), c='r')
plt.show()
사이킷 런으로 단순선형회귀
import matplotlib.pyplot as plt
import numpy as np
import pandas as pd
from sklearn.linear_model import LinearRegression

budget = np.array([5, 10, 17, 27, 35, 40, 42, 49, 54, 60])
revenue = np.array([2.6, 19., 23.8, 26.9, 41.1, 58.3, 40.3, 58.7, 73.1, 69.7])

X = pd.DataFrame({'budget': budget})

lr = LinearRegression()
lr.fit(X, revenue)

print('coefficient: ', lr.coef_[0])
print('intercept: ', lr.intercept_)

plt.scatter(X, revenue)
plt.plot(X, lr.predict(X), c='r')
plt.show()
다항선형회귀
넘파이
import numpy as np
import matplotlib.pyplot as plt

budget = np.array([5, 10, 17, 27, 35, 40, 42, 49, 54, 60])
revenue = np.array([12.6, 18., 20.8, 26.9, 41.1, 58.3, 40.3, 58.7, 73.1, 100.7])

m = np.polyfit(x=budget, y=revenue, deg=2)

print(m)

plt.scatter(x=budget, y=revenue)
plt.plot(budget, np.polyval(m, budget), c='r')
plt.show()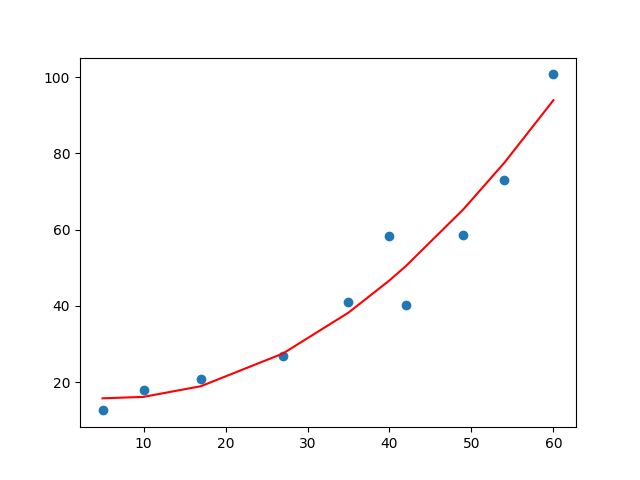
사이킷 런
전처리로 다항식(?)을 만들어준다.
import matplotlib.pyplot as plt
import numpy as np
import pandas as pd
from sklearn.linear_model import LinearRegression
from sklearn.preprocessing import PolynomialFeatures

budget = np.array([5, 10, 17, 27, 35, 40, 42, 49, 54, 60])
revenue = np.array(
    [12.6, 18., 20.8, 26.9, 41.1, 58.3, 40.3, 58.7, 73.1, 100.7])

X = pd.DataFrame({'budget': budget})

lr = LinearRegression()
pf = PolynomialFeatures(degree=2)
X_poly = pf.fit_transform(X)
print(X, X_poly)

lr.fit(X_poly, revenue)

print('coefficient: ', lr.coef_)
print('intercept: ', lr.intercept_)

plt.scatter(X, revenue)
plt.plot(X, lr.predict(X_poly), c='r')
plt.show()
다중 선형회귀
from sklearn import datasets, metrics, model_selection
from sklearn.linear_model import LinearRegression

dataset = datasets.fetch_california_housing()
x_data = dataset.data
y_data = dataset.target

x_train, x_test, y_train, y_test = model_selection.train_test_split(x_data, y_data, test_size=0.3)

lr = LinearRegression()
lr.fit(x_train, y_train)

y_predict = lr.predict(x_train)
score = metrics.r2_score(y_train, y_predict)
print(score)  # 0.6125957241205972

y_predict = lr.predict(x_test)
score = metrics.r2_score(y_test, y_predict)
print(score)  # 0.5890670070947299
반응형